In the realm of data management, time series databases are crucial for handling a vast amount of data generated by applications across various domains. There are different databases available to handle time series data. In this post, I am focusing on TimescaleDB, which is built on top of PostgreSQL. It offers robust scalability and performance for handling a large volume of time series data.
I am sharing our experience using TimescaleDB and how we have improved query performance.
I am sharing our experience using TimescaleDB and how we have improved query performance.
We have implemented a grid monitoring use case. The system generates substation data in every 15 minutes for all consumers, lines, connectivity nodes and transformers. The network consists of 4 substation, 3K transformers and 6K consumers. The system generates 6K meter data every 15 minutes.
We inserted the simulated data from the past year into TimescaleDB. The data includes information on lines, buses, solar, batteries, and consumer metering, all ingested every 15 minutes. For simplicity, this post will focus solely on the consumer metering data and load profile, which consists of 6,000 entries every 15 minutes.
Each row includes data on lighting, fans, cooling, heating, refrigerators, fans kW, total kW, and more.
After inserting one year of data, we executed some queries and observed the following results.
Query : Find total lighting load of a consumer for a particular day
A typical time series query takes approximately 233 seconds to execute!(Refer image Query Result 1)
We discovered that we had missed some fundamental steps for storing time series data in TimescaleDB.
TimescaleDB is fundamentally designed around the concept of hypertables, which are the primary structure for managing time-series data. If we create a normal table in TimescaleDB, these tables will not benefit from TimescaleDB’s automatic partitioning and indexing optimizations designed for time-series data.
TimescaleDB divides data into chunks based on time intervals. Choosing an appropriate chunk interval is crucial. Based on the requirements, we need to define the chunking strategy. Too small and too large chunk intervals are not recommended as it affects management and query performance.
We are using a chunking strategy of one day, as our use case typically involves querying daily data.
After migrating to hypertables, we observed a significant improvement in query performance for the same query. It now takes only 285 milliseconds! (Refer image Query Result 2)
After creating the hyper tables and optimized chunking strategy we got a huge performance improvement.
Indexing plays a crucial role in achieving efficient query performance. While TimescaleDB automatically creates indexes on time columns, you may still require additional indexes depending on your specific queries. We have created unique indexes for the name and time columns.
TimescaleDB supports compression as a means to reduce storage requirements and enhance query performance. Experimenting with different compression settings can help find the optimal balance between storage efficiency and query performance.
Materialized views are precomputed views of data that are stored on disk and can be accessed more quickly than regular views.Utilizing materialized views enables more efficient execution of queries, particularly for complex aggregations and joins.
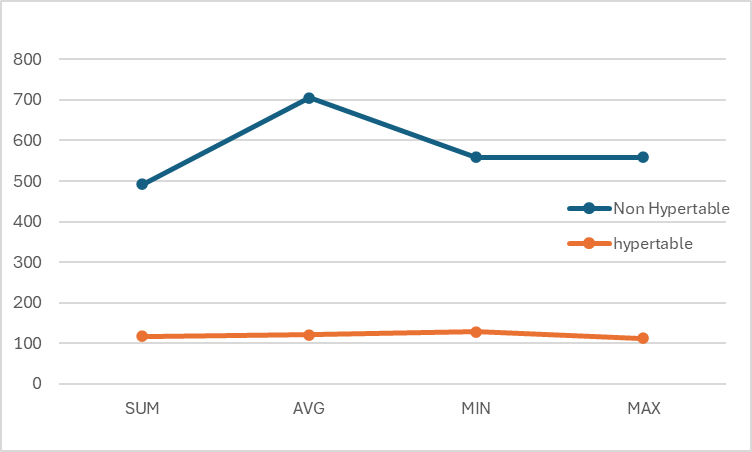
The following figure illustrates the difference in query timings:
This figure demonstrates the significant improvement in query performance after migrating to hypertables and applying optimizations like indexing and compression.
When working with TimeScaleDB, it’s essential to create hypertables and define a suitable chunking strategy.
To optimize both performance and storage efficiency, you can define indexing and compression techniques.
Materialized views can be utilized to precompute and store the results of complex queries. It’s crucial to refresh the materialized view at regular intervals to update the results.


